
You have built and published your first dashboards and you notice that business stakeholders are using them. This sounds like a big win! A common pitfall, however, is that for some reason after a while, business stakeholders go back to their trusted Excel files. How can we avoid this? In the following, we’ll explain how you can increase your chances of success when setting up Business Intelligence (BI) in your organization.
In other articles, we’ve explained the processes of Data Science, Data Strategy, and Data Foundations by drawing the analogy with soup being served in a restaurant. Let’s do the same here, to elaborate on what makes dashboards successful.
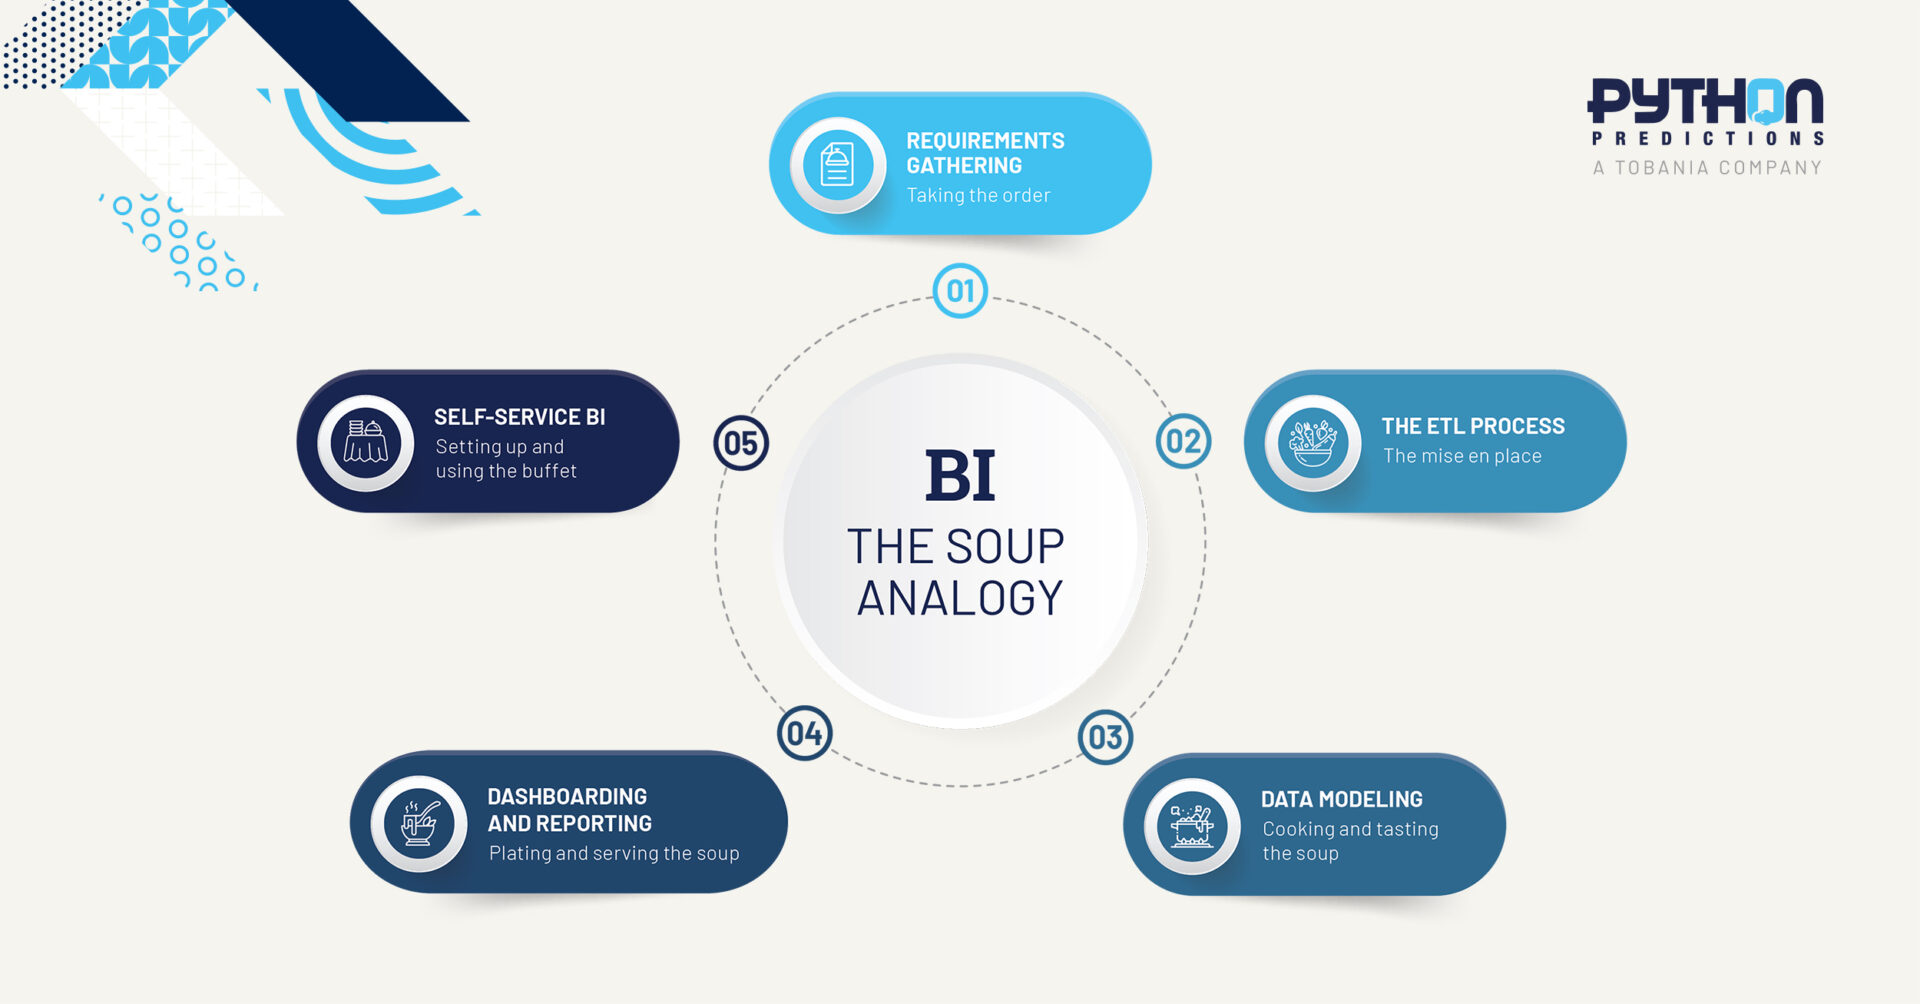
Phase 1: Requirements gathering and design
Taking the order
In a restaurant, the waiter will first welcome the customers and then take their order by asking the right questions to ensure the order is well defined.
The first phase of a dashboarding project is similar. Sufficient time and attention for detail should be spent on understanding the end users’ needs, priorities, and resources. In this phase, it is vital to start with the insights that users want to get from the dashboards, and work one’s way backwards from there. Some important questions are the following:
- Will the current data produce the desired insights or should new data be acquired?
- What are the key performance indicators (KPIs) for this project and how will we evaluate them?
- Will the dashboard be consumed on-demand, embedded in another application, or through an e-mail subscription?
It’s a common misconception that a data team would be able to draw conclusions from large amounts of data without having talked about any of the above-mentioned requirements.
Phase 2: The ETL Process
Mise en place
After taking the order, waiters will pass it on to the kitchen staff who will chop and cut the right ingredients for the soup. For those not familiar with (French) cooking jargon, ‘mise en place’ is a term used in professional kitchens to refer to organizing and arranging the ingredients such that the chef can do his or her magic.
In the BI world, this step corresponds to the Extract Transform and Load process (ETL). In this phase, data is extracted from a variety of sources, then transformed by cleaning, joining, or aggregating the data, and, finally, loaded into an analytical platform. Preferably, the ETL process happens as close as possible to the source that produces the data, because this ensures that calculations happen only once, reducing the overall complexity of data operations.
You can find amore information about this in the Data Foundations soup story: Data Foundations – from soup bar to factory • Python Predictions
Phase 3: Data modeling
Cooking and tasting the soup
Once the ingredients are in place, the chef will cook the soup by adding stock and stirring occasionally. A good chef can bring the soup to perfection by adding the right amounts of salt and pepper.
In our dashboarding project, this step corresponds to the creation of a tabular data model. This happens after the ETL process, when the data gets loaded into an analytical platform. The model represents relationships between data tables which makes it easier for the analyst to understand and analyze the data. Let’s take the example of a tabular data model we could build for the dashboards of our soup restaurant. In such a model an analyst could see that a soup was ordered in the “vegan soup” category, by a client from “New York,” on a “Saturday” in “June”.
Phase 4: Dashboarding and reporting
Plating and serving the soup
Once the soup is ready, it is time to present it. In a restaurant setting, “plating” refers to the art of arranging, decorating, and presenting food to increase its appeal . “We eat first with our eyes,” said by the notorious gastronomist Apicius in the 1st century, is as relevant as ever.
In BI there is a similar ‘plating’ aspect. A great soup served in an awful bowl may not be fully appreciated. The same is true for BI – a dashboard with fantastic insights but difficult or ugly visuals may fail to convince potential users. The point of data visualization is to make information easier for humans to understand. Therefore, it is important that the visualized insights immediately hit home when viewed by the end user. During this process, feedback is crucial. In a restaurant, the waiter will often ask “Are you enjoying your meal?”. Similarly, in the context of dashboarding, feedback is required to further finetune and improve the user experience.
Phase 4: Self-service BI
Setting up and using the buffet
The above draws an analogy between serving soup in a traditional restaurant and making dashboards. However, some restaurants have a soup buffet on display that offers customers a variety of quick and easy choices. Customers serve themselves how much and when they wish, in a fast and easy way.
In the context of BI, Self-Service BI addresses the same needs as the soup buffet. It enables business analysts, management, and other users to run queries themselves and to create their own visualizations, reports, and dashboards. A centralized analytical platform, a data catalogue, automated refreshes all facilitate Self-Service BI. No need to order and wait for insights, just serve yourself the way you like from the BI buffet. Hence, Self-Service BI can help organizations develop a data literate culture by helping employees learn the language of analytics, visualization, and data exploration.
Conclusion
By presenting the process of developing a Business Intelligence solution in analogy to cooking and serving soup in a restaurant we aim for a low-threshold approach. To further complete the soup metaphor one can also include the soup factory where raw materials are processed. This soup factory will supply us with the ingredients needed for our soup. This analogy refers to our data foundations offering. In case our restaurant would become more popular, we may also want to expand our menu. This decision however requires us to think through how we will scale; for your business this will result in defining a data strategy. Or you might be thinking of leveraging your company’s data through predictive analytics. Well, to make that process more digestible we have another soup (story) about our predictive analytics offering ready for you!
Let’s cook together
Did our soup story inspire you to discuss how we could help set up Business Intelligence in your organization? Contact us and we will open our kitchen to share our favorite recipes. We would love to help you take the next step in becoming The Intelligent Data-driven Organization!
